Congratulations on joining the renewable energy revolution! Your new solar panel system is not just generating clean electricity—it's also providing you with valuable data through your monitoring app. But if you're feeling overwhelmed by the graphs, numbers, and technical terms, you're not alone. This comprehensive guide will walk you through everything you need to know to become fluent in solar monitoring.
Understanding the Core Metrics
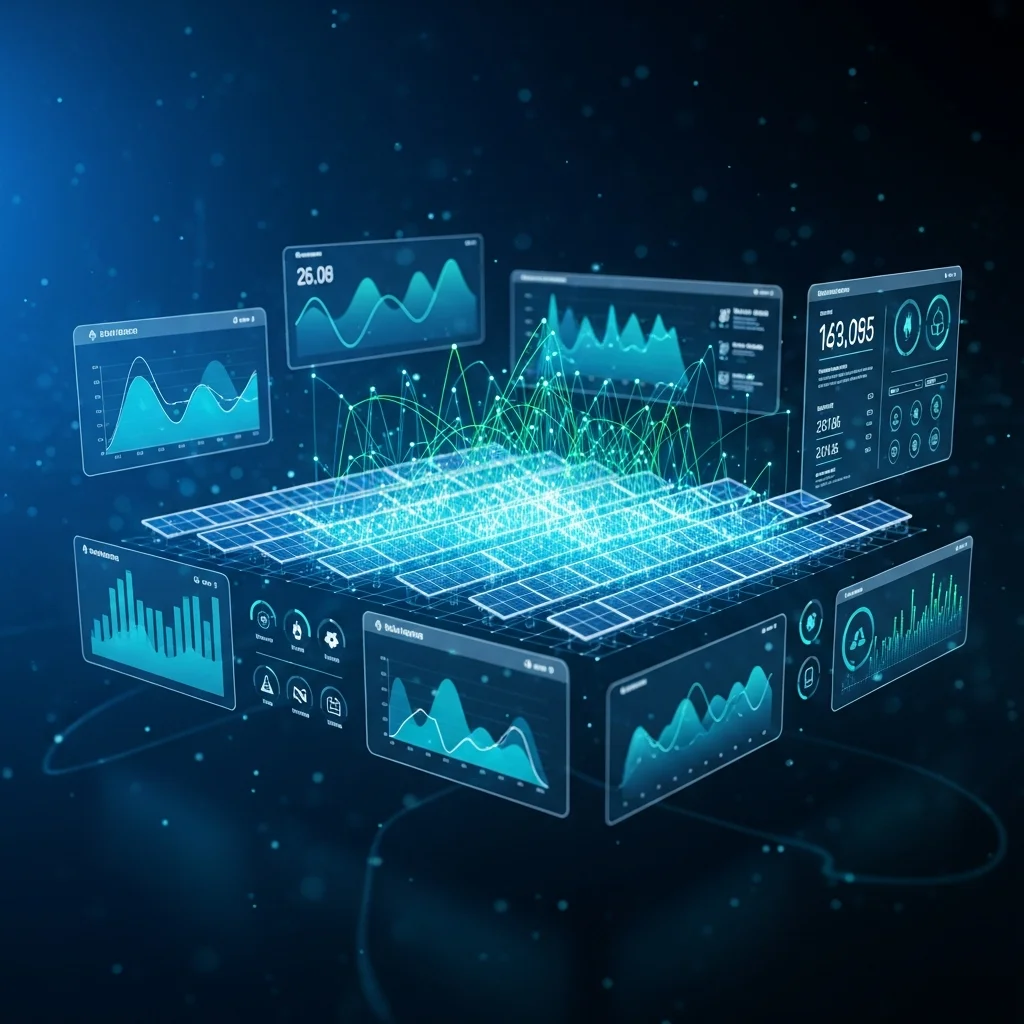
Your solar monitoring app displays several key metrics that tell the story of your energy production and consumption. Let's break down what each one means and why it matters.
Solar Generation
This is the most straightforward metric—it shows how much electricity your solar panels are producing right now. You'll typically see this displayed in kilowatts (kW) for real-time production or kilowatt-hours (kWh) for daily, monthly, or lifetime totals.
What to look for:
- Peak production usually occurs around midday when the sun is highest
- Seasonal variations are normal—you'll generate more in summer than winter
- Weather impact—cloudy days will show lower production than sunny ones
- Peak usage times—when your household uses the most electricity
- High-consumption appliances—identify energy-hungry devices
- Behaviour patterns—how your usage changes throughout the day and week
- Export typically peaks during midday when generation is high but consumption might be low (if you're out at work or school)
- Zero export during evenings and nights when you're using grid electricity
- Seasonal export rates—you'll likely export more in summer months
- Higher self-consumption means more savings—you're using free solar energy instead of buying expensive grid electricity
- Typical rates vary from 30-50% without battery storage
- Improving self-consumption can significantly increase your overall savings
- Solar → Home (self-consumption)
- Solar → Grid (export)
- Grid → Home (import)
- A smooth curve starting at sunrise
- Peak production around midday
- Gradual decline towards sunset
- No sudden dips during sunny weather
- Weekly views show how weekend vs weekday usage differs
- Monthly comparisons reveal seasonal trends
- Year-on-year analysis helps track system performance over time
- Shading issues (new buildings, tree growth)
- Panel soiling (dirt, bird droppings)
- Inverter problems
- Faulty panels or connections
- Partial shading throughout the day
- MPPT (Maximum Power Point Tracking) issues
- Connection problems
- Run high-energy appliances like washing machines, dishwashers, and electric vehicle charging during peak solar hours
- Pre-heat or pre-cool your home while the sun is shining
- Schedule pool pumps and other non-essential devices for daytime operation
- Summer: Maximise export during long, sunny days
- Winter: Focus on self-consumption during shorter daylight hours
- Shoulder seasons: Balance between export and self-consumption based on weather patterns
- Complete system shutdown with zero generation during daylight hours
- Error messages or warning lights on your inverter
- Physical damage to panels, cables, or mounting systems
- Consistent underperformance compared to expected generation
- Frequent disconnections from the monitoring platform
- Unexplained data gaps in your historical records
- Understanding your specific system's expected performance
- Help interpreting unusual patterns in your data
- Advice on optimising your energy usage patterns
- Predict your energy production based on weather forecasts
- Optimise your appliance usage to maximise self-consumption
- Quickly identify when something isn't working correctly
- Make informed decisions about potential system expansions or battery storage
A healthy system should show a smooth bell curve throughout the day, peaking around solar noon. If you see sudden drops or irregular patterns during sunny weather, it might indicate an issue.
Energy Consumption
This metric shows how much electricity your home is using. It's crucial because it helps you understand your energy habits and identify opportunities to save more money.
Key insights from consumption data:
By comparing generation and consumption, you can make smarter decisions about when to run high-energy appliances like washing machines or dishwashers.
Grid Export
When your solar panels generate more electricity than your home needs, the excess power flows back to the grid. This is your grid export, and it's what earns you money through the Smart Export Guarantee (SEG) or other export tariffs.
Understanding export patterns:
Maximising your export earnings means timing your energy use to avoid consuming during peak generation hours when you could be exporting instead.
Self-Consumption
This is one of the most important metrics for solar system owners. Self-consumption measures the percentage of solar energy you use directly in your home versus what you export to the grid.
Why self-consumption matters:
Interpreting Your Solar Graphs
Most monitoring apps provide several types of graphs that offer different perspectives on your energy data.
Real-Time Power Flow
This live display shows electricity moving between your solar panels, home, and the grid in real-time. Arrows or flow diagrams make it easy to see:
The direction and size of the arrows indicate where power is flowing and how much.
Daily Production Charts
These line graphs show your energy generation throughout the day. A healthy system should display:
Historical Data Views
Looking at weekly, monthly, or yearly data helps you understand long-term patterns:
Spotting Potential Issues
Your monitoring app is an early warning system for potential problems with your solar installation. Here's what to watch for:
Performance Red Flags
Sudden production drops: If your system normally generates 4kW at noon but suddenly only produces 2kW on a sunny day, this could indicate:
Irregular patterns: Jagged or inconsistent generation curves during optimal conditions might suggest:
Zero generation during daylight hours: This is a clear sign something's wrong—possibly inverter failure or grid connection issues.
Data Anomalies
Missing data: Gaps in your monitoring history could indicate communication issues between your inverter and the monitoring system.
Inconsistent readings: If consumption data seems unusually high or low compared to your normal patterns, it might be worth investigating.
Maximising Your Solar Benefits
Timing Your Energy Use
One of the biggest advantages of solar monitoring is being able to shift your energy consumption to align with solar production:
Seasonal Adjustments
Understanding how your system performs throughout the year helps you plan accordingly:
When to Contact CRG Direct Support
While many fluctuations are normal, certain situations warrant professional attention. Contact our support team if you notice:
Immediate Concerns
Performance Issues
General Queries
CRG Direct's Customer Support
We're here to ensure you get the most from your solar investment. Our support team offers:
Remote monitoring assistance: We can often diagnose issues by remotely accessing your system data.
Performance analysis: We'll review your historical data to identify trends and potential improvements.
Technical support: From simple app navigation help to complex technical diagnostics.
Maintenance guidance: Advice on keeping your system performing optimally.
Becoming Solar Savvy
Reading your solar monitoring app is a skill that develops over time. Start by checking your app daily to understand normal patterns, then gradually expand to weekly and monthly reviews. Within a few months, you'll be able to:
Your solar monitoring app is more than just numbers—it's a window into your energy independence and environmental impact. Each kilowatt-hour generated represents cleaner air, reduced carbon emissions, and money saved.
Ready to Optimise Your Solar Experience?
Whether you're troubleshooting an issue, seeking to improve your system's performance, or just want to better understand your energy data, our team at CRG Direct is here to help.
Get in touch with our solar experts today for personalised advice and support tailored to your specific system and energy goals.