Solar Panel Case Study: £1,000 a Year Savings From a Real UK Home
Over three years of real performance data and a six-year energy analysis showing consistent £1,000 annual savings from a £7,500 solar investment.
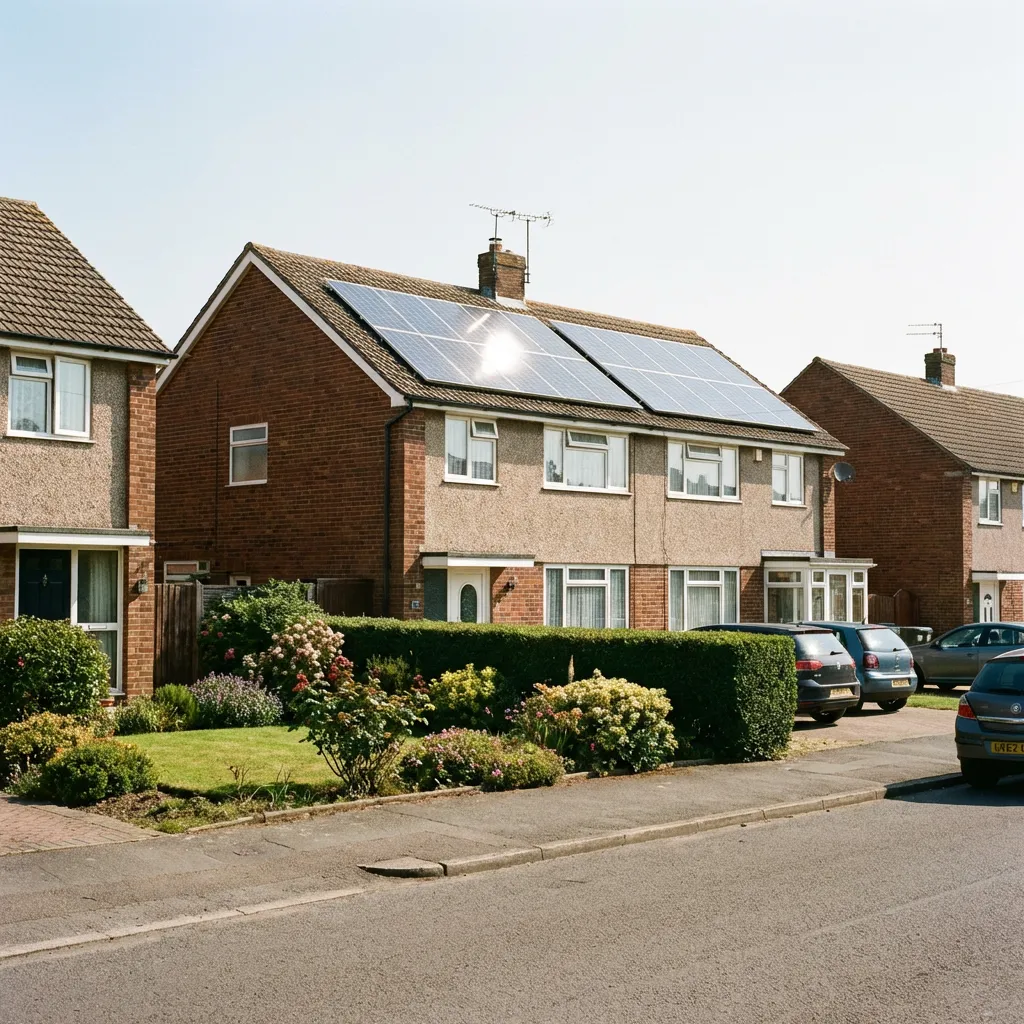
Hampshire • Residential
Annual Savings
£1,000
Bill Reduction
56%
CO₂ Saved
900 kg
Payback Period
7.5y
The savings and payback figures in this case study are this customer's actual results. Your own savings will be specific to your installation and depend on your energy generation and usage, and on energy costs at the time of installation.
" It is over three years since you installed our solar panels and we are very happy with them. We have made savings of about £1000 p.a. from an initial outlay of about £7500 (including payments from Octopus for electricity exported). "
Property Details
- Property Type
- Residential
- Location
- Hampshire
Services Installed
System Specifications
| Annual Generation | ~9400 kWh |
Overview of the Solar Installation
- Solar panels installed: Over 3 years ago
- Total upfront cost: ~£7,500
- System type: Solar PV system with export to grid
- Energy supplier: Octopus Energy
- Export payments: Included via Smart Export Guarantee (SEG)
The homeowners report that they are very happy with their solar panels and the performance of the system.
Real Solar Panel Savings
By combining reduced grid electricity imports with payments for exporting surplus electricity, the system delivers:
- Approximate annual savings: £1,000 per year
- Savings include:
This means the system is already well on its way to paying for itself.
Payback Period and Long-Term Savings
With an initial outlay of around £7,500 and annual savings of approximately £1,000, the estimated payback period is:
- Around 7-8 years
After this point, the electricity generated by the solar panels becomes effectively free, aside from minimal maintenance costs.
As energy prices increase, the value of the solar investment and the annual savings are likely to rise further.
Six-Year Energy Analysis
The homeowner has carried out a full six-year analysis of electricity usage, solar energy generation, energy exported back to the grid, and financial savings over time.
| Year | Solar Generated (kWh) | Exported (kWh) | Grid Import (kWh) | Total Usage (kWh) |
| 2019-20 | 0 | 0 | 2,975 | 11,499 |
| 2020-21 | 0 | 0 | 3,091 | 12,519 |
| 2022 | 0 | 0 | 2,948 | 11,352 |
| 2023 | 9,438 | 5,034 | 3,674 | 14,622 |
| 2024 | 9,010 | 4,814 | 3,634 | 14,446 |
| 2025 | 9,924 | 5,376 | 3,730 | 15,222 |
Exporting Surplus Electricity
A key part of the savings comes from exporting surplus electricity.
When the solar panels generate more electricity than the household needs, the excess energy is exported back to the grid under the Smart Export Guarantee (SEG).
These export payments provide an additional income stream and help shorten the payback period of the solar panel system.
Long-Term Financial and Environmental Benefits
Beyond direct financial savings, the system also provides:
- Long-term energy security
- Reduced electricity bills year after year
- Protection against future energy price rises
- A lower carbon footprint through clean, renewable energy
Are Solar Panels Worth It?
Based on more than three years of real-world performance and a six-year energy analysis, this homeowner's experience shows that:
- Solar panels save money
- Export payments significantly improve your savings
- Typical payback periods are realistic and achievable
- Long-term energy savings are substantial
Financial Summary
Previous Annual Bill
£1,800
Reduction
56%
New Annual Bill
£800
Annual Savings
£1,000
Related Case Studies
Ready to Start Saving?
See how much you could save with our personalized energy audit. Get a quote today.